Environment
Improving the environmental performance of
our customers, operations, and supply chain.
Our footprint
We believe that understanding environmental impacts across our
value chain is the first step towards taking meaningful action 1.
CDP, the world’s only global environmental disclosure system7, has recognized our actions to reduce greenhouse gas emissions (GHG) emissions and mitigate the risks of climate change to our business. In 2015, we were among the 5% of the companies participating in CDP's climate change program to be awarded a position on the "Climate A List" published in the CDP 2015 Global Climate Change Report. In addition, we were again included on CDP's S&P Climate Disclosure Leadership Index (CDLI), receiving the highest possible score of 100 out of 100 points. The CDLI spotlights those companies that disclose high-quality carbon emissions and energy data through CDP's climate change program.
Carbon footprint
49,067,700 tonnes CO2e
In 2014, our carbon footprint was 10% less than our 2013 emissions. We became the first global IT company to set GHG emissions
reduction goals for all three parts of our value chain, by adding an ambitious products goal.
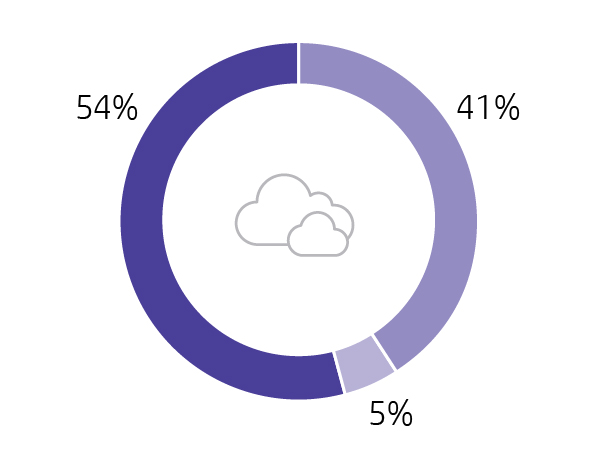
Supply chain 41%
Goal: 20% reduction by 2020
Greenhouse gas emissions in our supply chain result mainly from the raw materials used in, and manufacture of, our products.
Learn more
Operations 5%
Goal: 20% reduction by 2020
Greenhouse gas emissions from our operations result mainly from the energy used by our facilities around the world.
Learn more
Products & Solutions 54%
Goal: 40% reduction by 2020
Emissions from the energy our products and solutions consume after sale, while used by customers.
Learn more
In 2014, our carbon footprint equaled 49,067,700 tonnes carbon dioxide equivalent (CO2e), a reduction of 10% compared with 2013 emissions.8 The most significant change year over year was a 14% reduction in emissions related to product use, equivalent to 4.4 million tonnes CO2e,which accounted for about 79% of the total reduction. This resulted largely from improvements in our methodology to calculate GHG emissions related to personal systems energy use as well as increased product efficiency in our personal systems and printing groups, and shifts in product mix toward less carbon-intensive devices, (for example, from laptops to tablets).
Shipped volumes did not have a significant impact on the overall footprint year over year. We are committed to continually improving the accuracy of our calculations as we gain a better understanding of the aspects contributing to our footprint. See Supply chain environmental impact, HP operations, and Products and solutions for detailed information about how we work to reduce GHG across our business.
More detail about our methodology and each category of emissions is available in the HP carbon accounting manual (PDF, 240K).
Water footprint
330,083,000 cubic meters
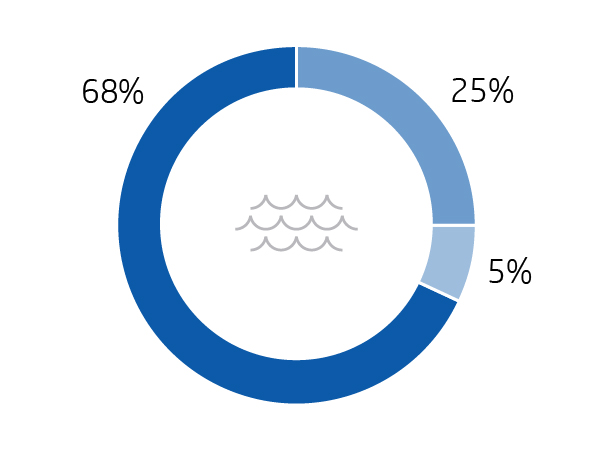
Supply chain 25%
Our suppliers affect our water footprint primarily through their use of electricity. We encourage suppliers to use and discharge water responsibly, and provide tools that improve water management practices.
Direct Consumption 23,296,000
Indirect Consumption 60,811,000
Learn more
Operations 7%
While our operations are not water intensive, water availability is a growing concern. We are committed to using less water, especially at operations in water-stressed regions.
Direct Consumption 7,431,000
Indirect Consumption 15,391,000
Learn more
Products & Solutions 68%
Customers using our products account for most of our water footprint. This water is indirectly consumed through using electricity to power our devices and through paper manufacture.
Indirect Consumption – electricity 176,960,000
Indirect Consumption – paper 46,194,000
Learn more
In 2014, our water footprint equaled 330,083,000 cubic meters, a reduction of 10% compared with 2013.9 The most significant changes year over year were a 17% reduction related to product energy use and a 6% increase related to paper manufacturing and use. Similar to our carbon footprint, the changes in estimated product energy use resulted largely from improvements in our methodology to calculate personal systems energy use as well as increased product efficiency in our personal systems and printing groups, and shifts in product mix toward less carbon-intensive devices. Electricity consumption is the largest driver of our water use across our value chain—77% of the total in 2014—because power generation consumes significant amounts of water. The bulk of that amount—54% of the overall footprint—is associated with electricity generated when customers use our products. This illustrates the close connection between energy, climate, and water consumption, and reinforces the importance of improving product energy efficiency.
The next largest factor is the manufacturing of paper used by customers in our products, 14% of the total in 2014. To reduce these impacts, we encourage customers to use paper efficiently (such as through duplex printing), to use lower impact paper, and to recycle after use (see our Environmentally Preferable Paper Policy). We continue working to improve our methodology and data as we better understand the factors that contribute to our footprint. Learn more about how we reduce water use across our business in Supply chain environmental impact, HP operations, and Products and solutions. More detail about our methodology and each category of consumption is available in the HP water accounting manual (PDF, 183K).
Learn more about how we are reducing water use across our value chain in our 2013 Living Progress Report (PDF, 391K).
Strengthening our communities and enabling the sustainable development of society
Acting with integrity and respect for human rights around the world
All figures contained on this page are reflective of Hewlett-Packard Company prior to the company’s November 1, 2015 separation. HP Inc. metrics will be introduced to the site on an on-going basis as they become available.
1. To calculate Scope 1, Scope 2, and Scope 3 emissions, HP has followed the principles outlined in the Greenhouse Gas Protocol developed by the World Resources Institute and the World Business Council for Sustainable Development. Additional details on calculations and methodology can be found in the HP carbon accounting manual (PDF, 240K).
2. HP calculates emissions intensity as its suppliers’ GHG emissions divided by HP’s annual revenue. This method normalizes performance based on business productivity.
3. Total GHG emissions from product use differ by less than 1% from the value reported on page 95 of the HP 2014 Living Progress Report, due to rounding.
4. De minimis values are less than 0.25% of total Scope 3 emissions.
5. Emissions intensity of the HP product portfolio refers to tonnes CO2e/net revenue arising from use of high-volume product lines, including notebooks, tablets, desktops, mobile computing devices and workstations; inkjet and LaserJet printers; and HP servers, including industry-standard servers, HP Moonshot and HP Apollo.
6. Expressed as emissions generated per unit of output. For printers and personal systems, each product constitutes a unit of output. For servers, each unit of output equals a task performed by the system, as defined by industry standards.
7. As of April 2015.
8. Data for 2013 (printer and server GHG emissions) are recalculated compared to information presented in the HP 2013 Living Progress Report, to reflect improvements to our methodology and to enhance comparability with 2014. See HP carbon accounting manual for details.
9. Data for 2013 water consumption related to printer and server electricity use, as well as paper use, are recalculated compared to information presented in the HP 2013 Living Progress Report, to reflect improvements to our methodology and to enhance comparability with 2014. See HP water accounting manual.
Supply Chain 41%
41% of total carbon emissions
Goal: Reduce our first-tier manufacturing and product transportation-related GHG emissions intensity2 by 20% by 2020, compared to 2010
Materials extraction through manufacturing
17,600,000 tonnes CO2e
Emissions associated with all levels of our supply chain from materials extraction through the manufacture of HP products.
In addition to our work with suppliers, HP’s Design for the Environment program considers environmental impact in the design of every product and solution, from the smallest print cartridge to entire data centers.
Capital goods
500,000 tonnes CO2e
Emissions associated with capital goods, from raw materials extraction through manufacturing and building construction.
HP practices sustainable building design to decrease these impacts.
Upstream energy production
300,000 CO2e
Upstream emissions of purchased energy, from raw material extraction up to the point of combustion, as well as transportation and distribution losses in the grid.
Transport
1,700,000 tonnes CO2e
Emissions from upstream and downstream product transportation and distribution, including retail and storage.
To reduce impacts, we work to maximize the efficiency of our supply chain network, shift to less energy-intensive modes of transport, and influence our logistics service providers.
Operations 5%
5% of total carbon emissions
Goal: Reduce total GHG from our operations (Scope 1 and Scope 2) by 20% by 2020, compared to 2010 levels
Facilities
1,552,600 tonnes CO2e
Scope 1 and Scope 2 emissions associated with energy consumption, perfluorocarbons (PFCs), and hydrofluorocarbons (HFCs) in facilities under HP’s operational control.
Transportation fleet
115,100 tonnes CO2e
Emissions associated with HP-owned or leased vehicles.
Commercial air travel
200,000 tonnes CO2e
Emissions associated with employee business travel by commercial aircraft.
We promote digital communications such as video-conferencing as an alternative to travel when feasible, and encourage less carbon-intensive forms of travel when possible.
Employee commuting
800,000 tonnes CO2e
Emissions from employee transportation between their homes and their worksites (in vehicles not owned by HP) and teleworking.
We promote programs in some locations such as ride-sharing, bike storage, and free shuttles from local public transportation to help employees reduce commuting emissions.
Products and Solutions 54%
54% of total carbon emissions
Goal: Reduce the GHG emissions intensity of our product portfolio5 by 40% by 2020 compared to 2010 levels6
Product use3
26,300,000 tonnes CO2e
Emissions associated with energy consumption of HP products across each of our major business groups, as well as the impact of paper and print cartridges.
We work to design increasingly efficient products and solutions that help customers reduce the environmental impact of their operations and personal lives.
Product end of life
De minimis4
Emissions associated with the operation of assets leased to other entities.
Building leased to others
De minimis4
Emissions associated with the operation of assets leased to other entities.
Investments
De minimis4
Emissions associated with corporate investments in business intelligence solutions, HP Labs, software and certain business incubation projects.
Supply Chain 25%
25% of total water footprint
Our suppliers affect our water footprint primarily through their use of electricity. We encourage suppliers to use and discharge water responsibly, and provide tools that improve water management practices.
Direct consumption
23,296,000 cubic meters
Water consumed by our suppliers in their operations.
We encourage suppliers to track and share their water impact and work with suppliers to improve the accuracy of their water data reporting.
Indirect consumption
60,811,000 cubic meters
Water consumption associated with the generation of electricity used by suppliers.
HP collaborates with several partners to promote energy efficiency among its suppliers through the HP Energy Efficiency Program (EEP).
Operations 7%
7% of total water footprint
While our operations are not water intensive, water availability is a growing concern. We are committed to using less water, especially at operations in water-stressed regions.
Direct consumption
7,431,000 cubic meters
Water consumed in our own operations, primarily for uses such as sinks, toilets, and irrigation as well as manufacturing support activities.
Indirect consumption
15,391,000 cubic meters
Consumption associated with the generation of electricity used in our own operations.
Improving energy efficiency in HP’s operations is the most effective way to reduce the company’s indirect water consumption from operations.
Products and Solutions 68%
68% of total water footprint
Customers using our products account for most of our water footprint. This water is indirectly consumed through using electricity to power our devices and through paper manufacture.
Indirect consumption – electricity for product use
176,960,000 cubic meters
Consumption associated with the generation of electricity used by HP products.
Indirect consumption – paper use
46,194,000 cubic meters
Consumption associated with the manufacturing of paper used by our customers with our products.
We encourage customers to use responsibly sourced and certified paper, to use it efficiently—such as through duplex printing—and to recycle after use.